Author: nluer

What is Ross EPM? Our 2nd video in the series.

Are you confused as to where things are going with your Ross EPM (Enterprise Performance Management) Business Intelligence solution?  If you have second guessed what you own with Aptean’s Ross EPM, what value you currently have with the solution, and what the future holds for EPM, watch the second video in the series as Business Impact breaks down the components, defines what you have, and lays out what is valuable within your  current EPM solution.

Watch this short video to learn some of the critical items you should know about EPM.

A few things you’ll learn in the second video in the series:

  • Clarification on BI terms.  ETL, WhereScape, TARGIT, Cubes – what is all this stuff?
  • What have I licensed with Ross EPM?  Is this a tool that I should keep? We think so, and let us walk through what you own and what your investment is worth.
  • What am I paying maintenance for? And what am I getting? Should I continue?
  • Do I have anything worth saving? Of course you do, and we’ll explain what and how to get the most out of it.

By the way, if you missed the introductory video… check out the first video in the series here!

ViewPoints 2015 Event Planning begins!

ViewPoints, Business Impact’s bi-annual customer event, is on track for 2015.  The informative event is two and a half days of training, networking, and learning the latest information on what is happening in Business Intelligence.  The event will be held in April 2015 and will kick off with two classroom training sessions on TARGIT’s latest release of their business intelligence tool.  The beginning TARGIT training course (101) will be a half day course of valuable introductory training on the basics of the latest version of the tool.  We have also added a FULL day of TARGIT 201 training that will focus on advanced calculations, gauges, and the most ambitious parts of the latest TARGIT business intelligence tool.

The main event will be “sandwiched” between the two training sessions, and will consist of a full day of Business Intelligence tracks to attend.  The breakout sessions will cover topics such as; the latest and greatest functionality in TARGIT’s new release, new client testimonials, what companies often overlook from their Business Intelligence solutions, and where our Consultants see Business Intelligence going in the future in your industry.  The event will allow time for guests to network with their industry peers on how other companies utilize their data to make better business decisions.  Wineries, Manufacturers, Convenience Stores and more industries will be attending the epic conference this year being held in Sonoma, California.

With new clients coming on board rapidly, we have outgrown our previous Napa resort location.  We are expecting over 65 clients for our main event, and up to 100 over the course of the three days.  With the increase in attendees, the location and finalization of dates will be confirmed and announced shortly.

We are excited to host the third annual ViewPoints event  in April 2015.  Watch for our upcoming emails that will be detailing more information on the event, and how to sign up for the session tracks and training.

Business Impact Launches a Cloud BI Solution

This week we launch our Business Intelligence solution for the cloud – Business Impact’s SaaS (Software-as-a-Service) solution.  Clients often ask us, why BI in the cloud?  What does business intelligence in the cloud do for my organization?  What will my company gain with a cloud BI solution?Cloud BI Logo

There are key benefits to a cloud BI solution for any organization.  Outlined below are a few of the reasons companies prefer a cloud solution over an on premise offering.

Affordable

Let’s face it, software solutions that are essential to the organization are expensive.  The software companies work diligently to keep their software up-to-date, cutting edge, and ahead of their competition.  It takes a lot of development cost to keep up in the technology world.  Clients are continuing to want the latest and greatest and software companies aim to make that happen.

With any SaaS solution, a customer pays a monthly subscription to lease the most current version of the software.  You “pay as you go” and always have the latest and greatest for your team.  Everything is included in your monthly low cost price per user fee, so there’s no unexpected out of pocket expenses throughout the year. You never have to consider a costly upgrade to a newer version that you own.  Your company always receives the current version of the solution when it’s released.  A cloud BI solution makes Business Intelligence affordable and attainable for even a smaller organization.  BI is not just for the “big boys” any longer.

CapEx versus OpEx Expenditure

A cloud offering moves the expenditure from CapEx (Capital Expenditure) to an OpEx (Operating Expenditure).  Now you still have the cost and outgoing of cash flow for the solution.  However it’s on a monthly basis, instead of a huge upfront expenditure.  Many organizations need approval from a committee to spend over a certain amount on a capital expenditure.  For many companies, it’s much easier to get approval for an operating expenditure then it is to get financial backing and buy-in from the entire decision making team.

A cloud BI tool extends to the entire organization, and the wealth of information that the leaders in the company will have access to will be huge for future decision making.  However, there’s always finite budgets for capital expenditures, and by having an option for it to be an operating expense often frees monies for other competing larger expenditures.  Often by moving the cost to an operating expense a department head can authorize a purchase and get their BI solution up and running quickly.

Low Risk

A cloud subscription based software solution is a diminished commitment.  With little upfront investment, you aren’t tied into a product like an on premise solution.  When paying for a cloud offering you pay your subscription fee and usually have a three year commitment with stated monthly subscription pricing.  So you know what the cost is per user, and you pay as you go.  If you no longer are interested in the product you move on after your subscription period ends.  If the product is still providing the value you expected after your subscription ends – you have the option of continuing service.  It’s a great way to reduce risk when purchasing a new solution.

Quick to Implement

With no capital expenditure, a cloud BI offering lowers the barriers to entry into the Business Intelligence space.  There’s no need to set up a traditional IT environment, which means your cloud BI solution can be rolled out faster and to more people within your company.

Companies are always surprised at how quickly they can get access to their data visually.  Your team will be making forward thinking business decisions on data they never had access to all in one place.  A quick implementation means your team is getting the benefit of the solution today!

Frees Up IT Staff

A cloud BI solution is an easy way to keep up with technology that your IT staff does not have to manage.  Every IT department has limited resources, and cloud BI won’t add to their already full plate. There’s no reason for them to maintain another BI project or to be tied up building tons of standard reports.  With cloud BI your users have power to manage their own reports and can slice and dice their data.  IT doesn’t have to hold the user’s hands, freeing them up for more strategic IT initiatives.

BI Analytics for Everyone

With a cloud BI solution you pay per user.  You only pay for what’s being used, which is a great way to save costs as well.  If you want to roll the solution out to more people, you only add additional users and with a little training they are up and running with the information they need to do their job more efficiently.  It’s that easy!  Expanding the power of a cloud BI to others is simple and takes little effort.

The lower Total Cost of Ownership and overall resource reduction in the IT department is increasingly appealing to our clients and prospects.  We are excited to be launching this new affordable offering to provide business analytics to all organizations no matter their size.

Please contact Eric Wenham for pricing or to find out more about how cloud BI can benefit your organization.

Eric Wenham
216 337 7386 mobile
ewenham@BusinessImpactInc.com

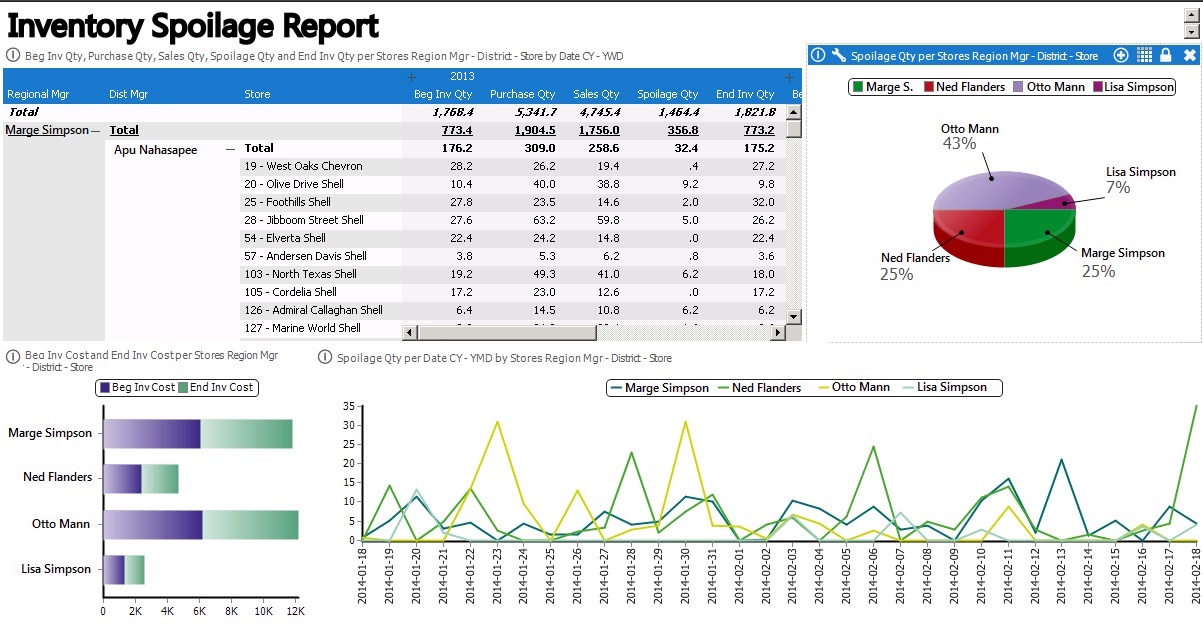
Convenience Stores Increase Profits Through Waste Management & Spoils

Convenience Store Increase Profits Through Waste & Spoilage Report

All convenience stores are aware of the impact of waste on profitability.  At the corporate level, are you getting access to the waste data in a timely fashion so you can quickly remedy the situation?  Store Managers are often head down busy, and don’t see how much waste is nipping at the toes of your profitability. A Business Intelligence solution brings your numbers to light, and makes sure everyone is meeting the profitability goals per store. Quickly your convenience stores increase profits through waste management and reduce your spoils, by getting the right information to your team at the right time.

In today’s C-store environment with slim fuel margins, executive teams need to efficiently capture inside sales margin dollars in order to survive.  There are many ways to analyze how to cut costs and save, but how accurate is your reporting, and not to mention, how long did it take to get those results??? A business intelligence solution allows your organization to see how much waste is happening at each store, compared to every other store, compared to last year, compared to last week, compared to…well, you name it.  The beauty is that the data already exists, but combine that with the flexibility, unique metrics and TA-DA, now you can access this information in a dynamic “on the fly” way.  You can see that hot dogs, cups, coffee, or sandwiches are being scrapped at a higher level then what’s allowed; and management can make actionable decisions to get things back on track before time gets the better of them.

North Carolina chain of convenience stores increase profits through waste management!

One of our convenience store clients gained profitability by starting to analyze their data on hot dogs. They took a look at what was being sold and what was being scrapped or wasted per store.  After a very short period of time (weeks instead of months), they made a business decision to pull roller grills out of certain stores where they were having weak profitability results.  There was no reason to keep wasting the hot food items, and in reality wasting the space for other more profitably items.  The Management Team agreed it would have taken them a year to make such a decisive decision in the past.  Now with the right data, at their fingertips and available to analyze, they came to the decision to pull the roller grills in a timely manner saving tons of waste, time, and sunk cost.  They even took it a step further with the locations that kept serving hot dogs and identified the average amount of dogs being served on a daily and timely basis.  Further decreasing their waste and saving tons of wieners!

Being able to see the waste and spoils allows a C Store business intelligence client to create PAR level goals at the corporate level for each store.  Corporate wide, this C store chain created a “Goal Sheet” with accurate goals for sales, waste, and PAR levels per day per store.  Managers at the store can log in and see what their goals are on a daily basis based on historical analysis of their data.  They have their goal planned for them from corporate, and can get back on the floor to oversee the team to make those goals happen.  Getting this information to the team at the store level helps everyone be on the same page and make the company’s waste and spoilage goals happen.

Loss prevention analysis not only helps you control and track your spoilage, but it will lead to better purchasing decisions and reassurance that you aren’t over ordering or stocking-out. With the right data, Store Managers can better account for items, and be sure to keep up on inventory goals.

To learn more about how convenience stores increase profits through waste management and other areas, contact us!  We’d like to share more stories that can benefit your convenience store business.


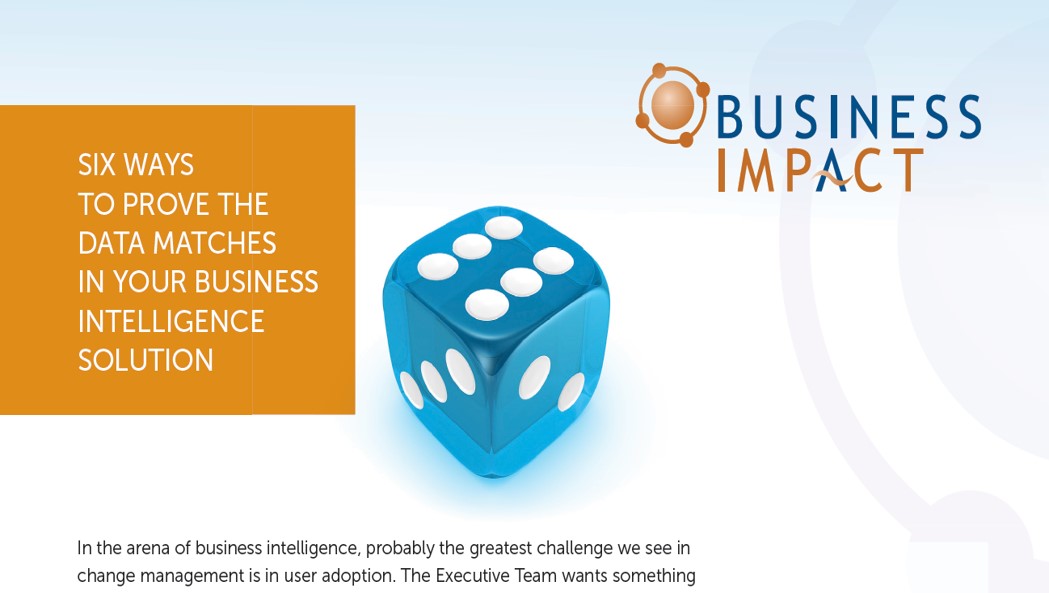
Six Ways to Prove the Business Intelligence Data Matches in Your BI Solution!

Are you struggling or worried that the business intelligence solution you spent money on won’t be utilized fully?  Are your employees resistant to change, or are you hearing rumblings in the break room that your staff is dreading the use of the new tool and might not trust your business intelligence data?

One significant way to make a business intelligence solution successful is to prove the data matches.  Your staff needs to trust that the data in the BI solution matches, again and again and again!  Although BI solutions can provide and point out “statistically relevant” differences, you need your staff to interpret the data in order to have a successful solution.

We have six recommendations to prove the data matches:

Six ways to prove business intelligence data matches

1) Create a Reference Document

Maintain a living document that takes the key measures and has two columns. Column A holds how the data is derived from the source system – this should be technical code of some kind that one can use in case of emergency.  Column B holds how the data is derived, retrieved or manifested within the BI tool. These should be technical instructions on how A and B should match.

2) Create Comparison Reports.

Second, create reports that calculate the values from the source system directly and the BI system and show the comparison. These reports can be set on some sort of trigger when values are out of whack, but it’s a useful management checkpoint to have someone quarterly look at these, confirm they have a variance of 0 and to confirm what we all come to expect, “Yep, it’s working.”

To read the next four ways to prove your data matches in your business intelligence solution click here to download the whitepaper!


business intelligence data


TARGIT and Business Impact Discuss BI Partner Success!

Doug Hoogervorst HeadshotRecently TARGIT’s team sat down with Doug Hoogervorst, Owner and CEO of Business Impact, to discuss how their partnership is generating success.  As a proven team, TARGIT and Business Impact transform company’s data into information, providing customers personalized business intelligence solutions for their organizations.

Why is their partnership such a success?  Business Impact unlocks the valuable data stuck in client’s IT systems through proper data staging and delivery of a dimensional data warehouse.  By understanding and focusing on solving business issues, Doug’s team delivers comprehensive business intelligence solutions.  Business Impact partners with TARGIT Decision Suite to display all of the client’s data in a streamlined and visually appealing fashion through customizable dashboards, comprehensive reporting, predictive analysis, and benchmarking.

In the interview Doug discusses industries TARGIT and Business Impact are successfully focused on, and their plans for going global.  He talks about the long-standing relationship with TARGIT’s team and how trust is key to any partnership, including theirs.  Doug highlights some of the events and support TARGIT and Business Impact have done for one another in the past years, and gives an idea into the changes that will be taking place in business intelligence in the next five years.  Both companies are happy with the successful partnership, and see the growth continuing into the future.

To read Doug Hoogervorst’s entire interview with TARGIT click here!

To receive more information on Business Impact’s solutions contact us at sales@businessimpactinc.com or give us a call at 919.537.8900.

TARGIT LOGO

ViewPoints Business Intelligence Event was a Success!

We want to thank all of our clients and partners that made ViewPoints business intelligence event a success in 2013. With so much changing in the business intelligence world, the day was spent discussing, presenting and learning new concepts in BI.  A few highlights from the ViewPoints event:[quote align=”right” color=”#999999″]”You put on a great venue. I like your presentation style, Doug! You find a way to make BI and data fun and relevant to non-geeks.”  Jean Sperlak – Olap Office [/quote]

Doug Hoogervorst, with all his humor, kicked off the ViewPoints event with a very popular topic – Master Data Management.  A challenge all organizations face because data resides in multiple systems.  How do we keep “item” from one system equal to “product” from another and “part code” from a third? MDM is the hot topic in business intelligence because it is not easy. For a limited time, you can access his presentation materials here! 
  

Many of our clients participated in presentations throughout the day.  Ava Jones, Enterprise BI Manager for AdvancePierre Foods presented with Doug in “PC: Not Politically Correct – but Product Contribution”. She discussed how APF’s Business Intelligence solution takes their data from 10 different data sources and applies that information to the actual product cost. Providing this information to Sales and the Management Team was crucial. Not to mention, the solution saved APF $50,000+ in the first six months in man hours alone.

Neal Cram, Don Sebastiani & Sons, was kind enough to present with the TARGIT Team during “Making Beautiful Dashboards: How to create the best dashboards for you organization.” A very popular session from the surveyed attendees commenting that, “creating dashboards, gauges, and “out of the box” data displays were a highlight to the event.”

Our Partners, TARGIT and OLAP Office held widely attended breakout sessions in the afternoon. TARGIT demonstrated their new release TARGIT 2013, which is expected to be available the beginning of July 2013. Howard Taylor, from OLAP Office, gave a informative presentation on budgeting for multiple reasons (financial, sales, depletions, production, reforecast) all in one tool! [quote align=”right” color=”#999999″]”Well done! I thoroughly enjoyed Dan’s 201 training session.” Colleen Gettle – Don Sebastiani & Sons[/quote]

Francis Smith, Senior Consultant, and Dan Cowan, VP of Consulting, led engaging TARGIT Training 101 and 201 courses the day before the event. The participants were thrilled that we added the courses to the event, learning more advanced views and calculations with the TARGIT tool.

Just before we finished the event, the Business Impact Consultants were available for Advisory Time, where we answered client specific one-on-one questions, recapped any of the sessions, and helped anyone with further training.

Winding up the event, we had a wine tasting and networking hour for all attendees. The wine was phenomenal, as our clients shared a few bottles from their wineries with the group.  The tasting was a great way to recap the day, network, and learn from each other on how to benefit further from BI.

We are looking forward to our next ViewPoints event. Thank you again customers, partners and Business Impact’s employees for making the event a great success!

Identifying Product Line Profitability through Landed Cost Analysis

Edit: The webinar is closed for registration (February 5th 2013)

Establishing landed costs for the products that a company handles can be a tricky business. There are freight costs, but they are not generally by SKU. There is trade promotional spending, which might be by item, by product group, or just to a customer. In order to accurately calculate the landed cost, all factors beyond the obvious Cost of Goods Sold must be considered.

Calculating landed cost is critical to understanding what a product actually costs and therefore what it can be sold for. Join us as we present how Business Impact and TARGIT helped Litehouse Foods master their Landed Cost requirements and significantly impact their product line profitability.

Click the Orange button and sign up for the Webinar through our partner Targit’s registration page. Takes only a few seconds.

Time: February 5th, 2013 at 2:00 EST

Recommended for: Logistics, finance, and manufacturing focused individuals looking to gain knowledge in Product Line Profitability.  Existing or prospective users of Business Intelligence solutions are welcomed too.

[toggle_box]

[toggle_item title=”Landed Cost Definition” active=”false”]The total cost of a landed shipment including purchase price, freight, insurance, and other costs up to the port of destination. In some instances, it may also include the customs duties and other taxes levied on the shipment. (www.businessdictionary.com)
[/toggle_item]

[toggle_item title=”System Requirements” active=”false”]

PC-based attendees
Required: Windows® 7, Vista, XP or 2003 Server

Mac®-based attendees
Required: Mac OS® X 10.5 or newer

Mobile attendees
Required: iPhone®, iPad®, Android™ phone or Android tablet

[/toggle_item]
[/toggle_box]

[divider scroll_text=”Back to top”]