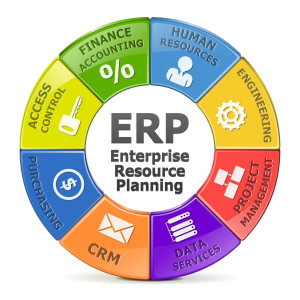
Is Your ERP System Doing Enough?
How confident are you in your current data gathering methods? Is it taking longer for your team to interpret your data because you have tricky graphs, charts and projections? When was the last time you considered replacing your enterprise resource planning (ERP) software?
If you find yourself asking these questions, then it’s time for you to heavily reconsider your ERP to find one that maximizes your statistics easily, affordably and efficiently. Plus, with several solutions on the market, there’s no reason why you should settle for a program that doesn’t meet your needs with quick, accessible data.
Common ERP Complaints
With all of the resources and research available at your fingertips, there’s no reason why you should settle. Below are some of the most common limitations that we’ve heard from our clients who are seeking to upgrade their ERP software to a more functional, fulfilling system.
Data is Too Jumbled
What good is your hard work if you can’t condense it into a readable, intuitive graph? The main idea behind having such a software is for executives to be able to make sense from complicated numbers. Perhaps your current solution has all the necessary info you’re looking for, but it’s separated in several other graphs and charts. Don’t settle.
There are other ERP solutions on the market that cater to your need of having all the data you need in the format that you want. Perhaps you’re a company that has grown too large to have QuickBooks® be your only source of capturing company statistics. That’s a good thing! Don’t let your ERP solution be the reason why your company’s growth gets stifled or why your profits don’t rise as much as it could.
Forecasting is Difficult
Being able to make financial projections is pivotal to how you conduct company operations in the present tense. And with the aide of an efficient ERP solution, it becomes easier to plan for the future when you can capture and analyze recent statistical trends.
By taking into account your key performance indicators (KPIs), a top-of-the-line ERP software goes beyond sales — but can also document your accounting, inventory, budgets, shipments, production and more.

businessman in his office desk full of graphs and charts observing a chart with an upward trend
My Team Can’t Understand the Data
“Do you know what this means?” If that’s too common of a question that your executive board is asking, then perhaps it’s time for a change. Growing your business is important to each member of your team and shouldn’t be derailed or delayed because of poor organization on the part of your ERP system.
When the boss is not in town, can you put the trust in your team to make high-quality decisions in your absence? Your business intelligence tool is supposed to be intelligent and simple so that no matter who is analyzing your data, they’ll be able to make sound business decisions.
End-of-Quarter Tasks Take Too Long
Time is money and as a business, you never want to waste either. When it’s time to analyze the most recent three months in your company, do you sometimes feel like the process could move along faster if you had more — or better — information?
You’re wasting money and minimizing your productivity by spending ample amounts of time trying to capture the progress of your most recent quarter. Cut the fat off of your analysis methods by subscribing to an ERP solution that takes into consideration your need to get quick, well-organized data.
In summary, your business should not settle for a business intelligence software if it’s causing you more problems than solutions. Here at Business Impact, we have front-end and back-end solutions that will truly simplify the way you capture, stage and display your data.
