Month: March 2014

Take Control of Your Convenience Store Purchasing Data

The glory days where distributors offered full guarantee on all spoilage seems to be gone and in general we see a trend of more and more activities being pushed downstream and your convenience store purchasing data is becoming more and more important to your profitability. We see store owners struggling to cope with:convenience store purchasing data

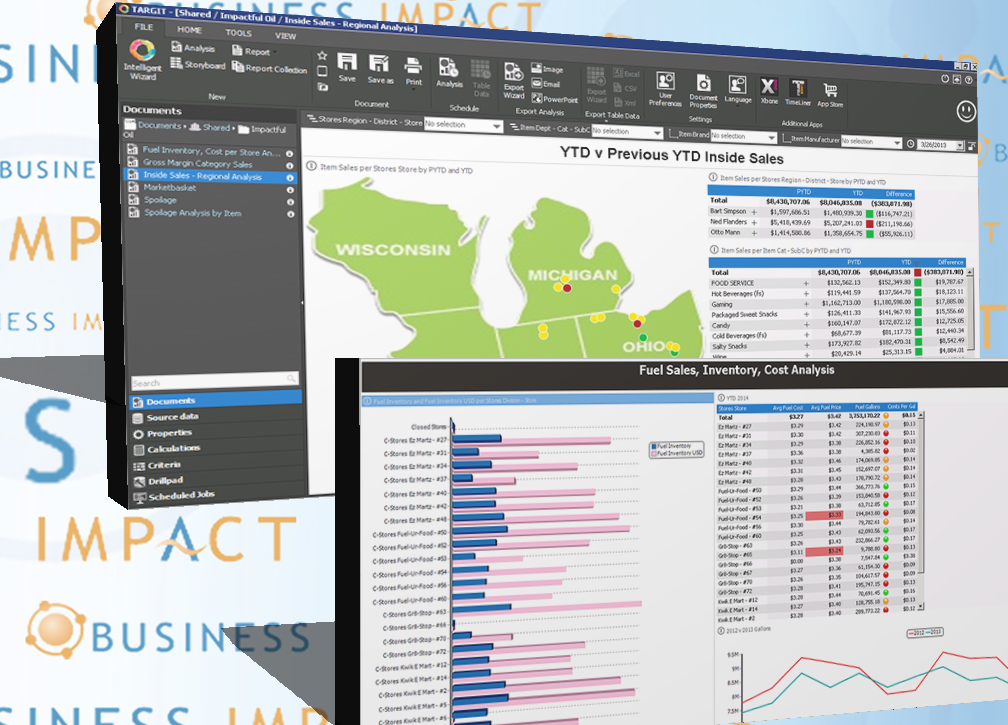
  • The need of speed and granularity with reporting
  • Coping with new areas of responsibility and how to analyze convenience store purchasing data
  • Becoming less reliant on distributors and their reporting
  • …and the C-store industry and competition is still growing!


Meanwhile, the environment is also changing and fuel efficient cars lower the frequency of opportunity, which only increases the opportunity cost caused by poor purchasing practices.

While analyzing the in-store data, what are your determining factors that identifies if a product should be rebought?  At what quantities? Or should a product be terminated from your price book?  How do you review your collected information with your distributors to negotiate better rebates or incentive programs? Is the speed of reporting appropriate or are your data reviews taking too long and causing stores to stock out on high margin products, ultimately costing you real dollars?

Here at Business Impact, we offer a solution that can take control of your convenience store purchasing data.  Business Intelligence is a growing need for all and we are focused on your industry to deliver reports and analytics like you’ve never seen before.  Our solutions offers flexibility and interactive interface that makes it simple to roll up daily data to week, month, quarter, then drill back down… or go from store totals, then drill down to category, sub-category, employee, etc…  It’s all up to the user and being able to easily and quickly display the data they are needing to discover the information they are looking for.

Here’s how we can help:

  • Reduce labor costs by automating processes and data
  • Cut out data traffic jams by enabling all users, not just IT
  • Making data actionable though indicators and alerts, and reducing clutter
  • Aligning business performance with objectives
  • Making better, faster decisions, making your C stores more profitable


Understanding the c-store environment, we have successfully deployed solutions as well as offered additional requirements that may have once been overlooked.  Don’t rely on your distributors’ data that may be inaccurate and possibly cost you missed rebates.  Automated pattern recognition and alerts will help increase your ability to predict high margin products stock levels, quickly allowing your team to discover which items may be a loss leader, or a hidden gems that deserve better placement.  Improve your ability to strike a healthy balance between profitability, inventory cost and sales flow by comparing across regions, districts and stores.  Analyze Inside Sales per square foot by department or category or whatever else you desire.  See average market basket of any transaction that has a Coke in it.  Or any Coke product.  Can you compare that with Pepsi?  We can!  You never have to go into a distributor meeting unarmed.  Have your convenience store purchasing and sales data at your fingertips.

Automating the collection and organization of your data for usage is a large part in any successful BI solution.  We pull the necessary data from the back office systems and other data sources.  Data can come from your accounting package, spreadsheets, a labor system, or somewhere else.  We focus on what adds most value, the ease of use, flexibility and performance is the design and management of this organization for delivery.

Check out our latest three minute video demonstrating convenience store’s Inside Sales Analysis.  Or contact us to learn more!


Wine Depletion Data and its Influence on the 3 P’s

How important to you is knowing your actual inventory level with your distributors.  Or knowing which product is being sold out of which retailer.  Some may say, not very, since your books already reflect a sale.  Others may reason that it’s hot on the priority list, so you can better manage your products, promotions and process

09) On Premise National Accts.1

Click to view larger image

The data provided to small and mid-size wineries often does not show product stock once it has been received by the distributor.  These wineries aren’t always aware of what retailer or restaurant is receiving their product.  If you were to say that you aren’t concerned because the initial sale already occurred and you collected your money for the distributor, than you are missing the big picture.

PRODUCTS:

What if your inventory was sitting in one distributor’s warehouse versus another’s who was completely out of stock?  Maybe certain products are received better in certain regions of the country, would that make you allocate your resources more effectively the following year?  Or perhaps one of your products never moves out of any of the distributors hands and just collects dust.  That’s probably going to affect two things, the relationship with your distributors since they were stuck holding onto your product, but also you may rethink production of the wine, or even review the marketing efforts as a whole.

Understanding and knowing where your product ends up is a very important factor when it comes to making key business decisions.  The term used in the wine industry is known as wine depletion data to refer to sales from distributors to retail accounts.  The information below is the typical depletion results that are provided to wineries.

Wine Depletion

Click to view larger image

Typical Wine Depletion Data Results:

  • Shipment Data
  • Inventory Data
  • Retail Account Data


The typical wine depletion data provided is great to have and provides some insight into where your product ends up.  But the data can be analyzed so much further, giving your winery a leg up in promoting your product, or having your product become more profitable.

PROMOTIONS:

A winery that produces, let’s say 100,000 cases, only has a certain amount of resources to effectively promote and place to distributors.  Essentially once the last case is sold to the distributor, the winery’s job is done.  But is it?  Wouldn’t it be nice to know which product did the best and in which account or region?  That’s where wine depletion data combined with savvy business intelligence reporting helps answer those key elements.

Obtain the data on your product and analyze it against multiple amplitudes to diversify next year’s allocations and increase productivity.  Find out which product sold out the fastest to end customer to help manage production for upcoming years.  Evaluate the marketing efforts at a certain time period on a particular product to really understand how effective it was.

 Business Intelligence Wine Depletion Data Solution:

  • Monitor cases and bottles sold, annual revenue, yield, and profit margins associated with your sales force
  • Measure annual case production, vineyard acreage, grape harvest, quality of wine and service level
  • Track the sale of wine from distributor to consumers
  • Keep track of inventory including barrels, bottles and every component needed for packaging
  • Identify strengths and weaknesses in your distribution channels such as FOB, operating costs, on/off channels, number of accounts, lost accounts and new accounts


This list can go on and on and on, which is all helpful to increase success, but exactly how do we get there.

PROCESS:

Wouldn’t it be nice to be able to take it a step further and compare your wine depletion data to your internal sales data or allocation figures or shipment records?  Think about it, how much more could you possibly gain by being able to relate all your available data, internal & external, to uncover potential areas/departments that may need attention.  Some may argue that they sell out of their stock on a continual basis, but what if you were to implement a business intelligence solution that finds an opportunity to increase profitability among your allocations or reduce the cost of sales with shipments.  Businesses change often and quickly, so eventually there will be areas to improve or revamp.  None of the data collection sources alone will be able to deliver an enterprise business intelligence solution to ensure all of your departments are functioning at full capacity & efficiency.

The wine industry is different from any other product out there.  The reason being is the main ingredient, the grape!  Depending on the size of the vineyard, there are only so many grapes that can be plucked and squeezed to give us our always deserving juice!  So, limitations of the beginning product prohibit us from being able to call down to the production floor when inventory runs low and tell them to increase output.  Plus, after these grapes have been squeezed out of every last drop they don’t see the inside of a bottle, but a barrel, where they mature and ferment for periods of times, usually lasting longer than a couple years.  Again, there are limited resources in the wine industry and simply put, you can’t just increase production because you see an increase in demand.  It’s vital in the wine industry to get access and analyze your wine depletion data to have a strong understanding of who’s consuming your wine to stay competitive and knowledgeable in the industry.

Learn more about winery depletion data and analytics by viewing our Wine Webinar here!