Tag: Business Intelligence

What Makes up the Total Cost of BI?

If you’re currently in the market for a business intelligence solution, then it’s assumed that your organization is in the mind-state of growth. It’s likely that your business is growing at a pace that is getting difficult to handle or maybe the pace is consistent, but you have a thirst for a new way of managing your analytics and internal statistics.

Whatever your reason, business intelligence (BI) has the potential to revolutionize your company and the way your employees perform their duties.

While a business often shows interest in investing in business intelligence, they soon become hesitant once the conversation of cost comes up. And rightfully so — the decision makers of a company want to be able to maximize their revenue and only invest in long-term solutions if it’s absolutely necessary. We understand this.

Cost of business intelligenceMost businesses should be concerned with their bottom line, but they should also be concerned with the future of company operations to ensure the growth of their company lasts longer than the present.

While the costs of implementing a full-fledged business intelligence solution varies greatly by provider, additions specific to your industry or company, licensing and more, we won’t be able to give you the exact dollar amount that you want to read. However, what we can tell you are the major components that will make up the cost that you’ll be billed for after you receive a quote from a vendor. And that’s what we’ll do below.

Software

This portion of your BI solution is the meat and bones of the overall BI concept. While the cost of the software has a wide range, this is the part where it’s all up to you to determine which capabilities you want, what kind of interface works best for your team and which vendor are you willing to partner with for the next couple of years. This portion of your overall BI investment is the first to be determined, but is not the majority of the cost of the entire BI package.

Installation & Implementation

In most cases, the vendor that provided the software will also have to install it into the workplace. And these prices can get costly. Often times, the installation is just the beginning as tasks like report building or configuration have to also be taught to the users of the new BI software. But prior to having the software installed, make sure to analyze it to make sure that it’s as user-friendly as you intend it to be and has an easy integration process.

User trainingUser Training

What good is a business intelligence solution if it’s difficult to navigate, right? It’s a necessary part of the process as you don’t want to invest in a new technology and have your team be reluctant or too nervous to make use of it. Before you invest in any solution, ask about how long it would reasonably take to train a staff of your size.

Administration

Who’s going to be the boss once the installers leave? With new software comes new responsibility and this is something that can either be assigned to your IT team or can be a totally new hire. The costly part of determining and training an administrator is the fact that training them will take them away from their already-established duties. Depending on your BI solution, you may want to hire a consultant to help you manage the software and its accompanying tools.

Upkeep & Maintenance

Just like your car, you have to keep the machine well oiled and running smoothly. Budgeting for this portion can be difficult to gauge as many unforeseen issues can arrive. Look into change management processing when researching your BI solution. This way, you’ll be able to see which applications or reports are being used the most and see the ones that aren’t adding value to your company operations.

While you will likely have to speak to a vendor to get hardcore numbers or projections, we hope this post will help you understand the major sections that will make up that quote.

Remember, business intelligence is an investment that will likely take a while to perfect. However, it should ultimately serve your organization with high-quality reporting and analysis so you can continue to achieve success and fluidity within your operations.

epm_blog

What to Do When Your BI Expires

As the saying goes: all good things must come to an end. And the category of “good things” should definitely include your business intelligence software. In order to keep your technology up-to-date (and to make sure you continue paying the supplier), BI software providers make it a note to add new features every couple of years. Sometimes, users are able to continue on their current system for several years without upgrading, but even those original softwares will eventually expire.

In this post, we’ll evaluate your options once your business intelligence solution becomes no longer valid.

Considering Your Options

Before any major decisions are made, it’s advised that you take the time to weigh your options to determine which one will give you more bang for your buck. And more than that, remember that business intelligence is an investment that pays off in time. This means you should prioritize getting the best data for your organization first and then look at pricing as a second priority.

Staying & Upgrading

As a recent and relevant example, Microsoft’s SQL Server 2005 has served users with a decade of business intelligence. Now, despite its long-tenured history, that 2005 version is set to expire in April 2016. While users can migrate to a new system entirely, they can also simply upgrade to the 2014 version of SQL Server. This saves staffs ample amounts of time by staying with the same framework and only having to learn the updates, rather than an entirely different software.

Another perk of staying with your BI solution is that the migration of data from one system to another will likely be seamless as companies are eager to move you to their latest versions. There’s great value and comfort that comes with staying with your already-established team and if you’re satisfied with the service up to this point, then hopefully their upgrades will appease any of your doubts.

Migrate to Another System

Of course, another option organizations have is to ditch their current BI supplier for another one that may be more promising. Due to contracts or user agreements, some companies may feel trapped with their BI supplier and have decided to just make the most out of their equipment until it expires.

Once it expires, however, it can feel like a breath of fresh air where all the options are now on the table again — like a free agent athlete. If you find yourself in this situation, make sure to evaluate your last BI software.

Ask yourself: What did I like? What more do I need? How much am I willing to spend? What kind of data will be necessary?

When you have these questions answered for yourself, make sure to drill the sales teams of other BI suppliers to ensure your next commitment is fruitful and effective for your company.

Ditch BI Entirely & Go Back to DIY

The least popular option when your BI solution expires would be to take a step back and ditch BI software entirely. This option may work well for organizations that are losing money or aren’t big enough to warrant such heavy data collection.

Rather than searching for new technology, one can look for an in-house specialist to analyze data and help coordinate decision making. This option can be extremely less expensive. Plus, one will have the opportunity to speak to someone about their data rather than trying to understand what the software is trying to tell you.

No matter which of these options you choose, it’s imperative that you speak with your managers and decision makers to ensure your next step is one in the right direction and towards a more efficient and profitable business.

epm_blog

Adding an “As Of” Date to TARGIT Reports

Financial statements in TARGIT are often constructed with comparisons and calculations for more exact formatting. The comparisons can hold elements for current and previous years, quarters, months, or any combination of time you can think of. We have had trouble in the past with adding the actual date to these TARGIT reports, especially if we’re using the dynamic date origin to go back in time to see data before today.

While the “as of” date is visible in the client view, it is (or has been) difficult to see the same date in a report, since the dynamic date origin can’t be added to the printable page.

Two possibilities we tried and immediately rejected were using a detail band with the ‘Posting Date’ dimension (Picture 1) and a crosstab header band with a text element (Picture 2). The detail band attempted to pull every single date and locked up TARGIT with its data request. The text element sort of worked, but it was impossible to line it up to the correct column after data was fetched for the report.

Picture 1

Picture_1_-_Report_detail_band[1]

Picture 2

Picture_2_-_Header_band_text_element[1]

The next solution we tried was adding dynamic captions to the time comparison. Unfortunately, this is an “all or nothing” action: you can’t have a caption on just one column (the current or YTD column), and you can’t hide the other captions on the elements through Properties\Visibility. This is a big deal when you’re using a comparison with many elements; you end up with lots of different dates in the header, making it harder to read.

Picture 3

Picture_3_-_Comparison_before_captions[1]

Picture 4

Picture_4_-_Comparison_after_captions[1]

Finally, we started thinking independently of the crosstab with the comparison or trying to line up a text element with a crosstab column “just so.” We built a separate crosstab with the intent of hiding all of its data and essentially using it just for its column header. This column header shows a comparison with a single element, YTD, and the header uses a dynamic caption to display {posting date:last} from the Date dimension.

Picture 5

Picture_5_-_YTD_definition[1]

Picture 6

Picture_6_-_YTD_dynamic_caption[1]

Only one measure and the comparison are required to make this work. The measure number is masked under a visibility agent (hide all values), and the data row background color of the crosstab theme is changed from grey to white to make it seem more like a simple header than an empty crosstab; this also helps with the spacing in a report.

Picture 7

Picture_7_-_YTD_visibility_agent[1]

Simply add a new crosstab band to the top of any report and import this “As Of [Date]” object into it. “Fit to page width” is an excellent option to apply here, and voila! You can display today’s (or yesterday’s, or any day’s) date on the TARGIT reports easily and with no confusion.

Picture 8

Picture_8_-_Finished_product[1]


Learn more on how to improve your Business Intelligence solution and TARGIT reports below!

how_to_hide

Is BI Worth the Money?

If the conversation of business intelligence comes up, one of the first questions that will come up from interested companies is “Is it really worth the investment?” And that’s a tough question to answer as it’s hard to give out guarantees because much of the payoff has to do with the work done on your end.

One thing that is certain, however, is that if you’re having trouble with the flow of your business and currently don’t have a BI solution, then there’s great potential for a more effective and streamlined workplace with one.

It’s easy to get overwhelmed by the mounds of information that has to be collected, analyzed and shared amongst your team. And this is where business intelligence thrives. But back to the original question: is it worth it? To answer this question, we’ll break down the areas of a basic business infrastructure without BI and see how a BI software can drastically improve company operations.

Business intelligence.Data Collection in One Place

A workplace without any type of business intelligence is likely working with a few different softwares. Now, while this may work, it is likely more time consuming than it has to be and more scattered than it should be.

Multiple spreadsheets, softwares and networks can become a pain for employees and can certainly slow down the workflow. BI allows a company to gather all of this data in one central location for the convenience of the employees on every level. With all the time that would be saved with a new software, employees will have more opportunities to handle other tasks, which could possibly generate more revenue for the company.

Employee Training

For staff members who are in charge of data collection, having multiple sources for data can become a breeding ground for bottlenecking. With the assistance of a business intelligence software, these individuals have the opportunity to maximize production as the technology will help to lighten the workload.

Due to the high volume of one’s workload, it’s not uncommon to get delayed in reporting. If your team has multiple people assembling data and coordinating its distribution to the company’s decision makers, a BI investment can turn that segment of big data collection on its head by getting those reports to management faster.

When it comes to analyzing these inefficiencies in your company, another question has to be raised: are these setbacks actually costing my company? And more than just general revenue, these less-than-optimized operations can be costing your business opportunities and wasted time.

Statistics Proving Technology Works

And while these are hypothetical scenarios that are listed in this post, there is actually research that’s been conduct to show the return on investment for business analytics and intelligence tools. According to Nucleus Research, analytics and its payoff is huge.

“In analyzing ROI case studies on analytics, we found the average returns from analytics have been increasing, reaching $13.01 for every dollar spent in 2014 from just $10.66 in 2011.”

That’s 1300%! That’s pretty impressive — and worth the investment.

Fortunately, the transition to business intelligence doesn’t have to be a drastic one. Starting with the basic technology is a big step in itself that saves your company the trouble of finding a way to put all the most important big data in one location. Once you see the results yourself and the payoff starts to show in your actual bottom line, you can use what you’ve earned to invest in more technology to further improve your company.

epm_blog

4 Effective Practices for Data Visualization

What is the biggest pitfall in your business intelligence solution? For some, they’re lacking the proper technology to provide the big data that’s needed for their decision makers. For others, it’s the ease of use that’s required to maximize the capabilities of their BI technology.

Best case, you have no limitations in your technology and are simply scanning through this paragraph to see if one will be exposed.

Data VisualizationNonetheless, even if your BI solution is up to par, the display of the information can likely be optimized. Data visualization is a segment of business intelligence that cannot be underestimated or undervalued. Visualization is a loose term that encompasses the tools used to display information in the form of charts, graphs, histograms and diagrams.

It’s likely that your current technology has tools within the software where you can edit your visualization tools. In this post, we’ll break down the best practices for data visualization so you can make sure you’re getting the most out of your technology and that your higher-level employees have the best formatted information to make those tough business decisions.

Design for the Audience

As your company is made up of different departments, personalities, experience level and more, you should take into account these differences in your data visualization methods. Some people absorb information more visually, while others prefer text. Your BI software should allow you to display the same information in different formats to make this easier for your presentation.

It’s also as important to make sure that the information you’re emphasizing is clear and obvious in the visualization. Whether you’re sending data in an email or having a physical presentation showing important statistics, it’s crucial that the format is digestible, clear and informative in a way that’s easy on everyone’s eyes.

Focus on the Message

With several key points that your software is likely accumulating for you, it’s easy to get carried away with statistics and numbers that may not even be relevant to your core intent. Our advice is to stay the course and focus on the message that you want to highlight. Don’t stray away from that message unless it somehow relates back to the main point.

For instance, if you’re trying to use your data visualization tool to display sales over the last quarter, don’t jump to inventory statistics unless your growing inventory relates to how your sales have been rising in the last few weeks. Also, don’t be afraid to make several visualizations. You need not try to cram everything into one graph — use all the tools you have to your advantage!

Write KPIs on the Graphic

Key Performance Indicator KPI Evaluation Accounting ConceptEspecially when you’re presenting information to sales-minded employees or executives with little time on their hands, make sure that the most information is right there front and center. Depending on your BI tools, you should have the ability to write the key performance indicators (KPIs) on the graph itself and label important factors that may contribute to your overall presentation.

Whoever is receiving the information should be able to read the graphic without the need for further explanation — and any type of guidance that can add value to the graph serves as a great help.

Display the Data Accurately

There’s a fine-line between being thorough and being data-heavy. You don’t want to overload viewers with information, but you also don’t want to leave any important out. Ask yourself, “will people be able to understand the information if I were to take this point out?”

When making graphs, always be sure to be consistent with how you label them. For instance, starting an axis at 0 should always be done. Starting it at a different point can inflate the graph to make it look more impressive or more daunting (depending on the numbers). So, for consistency’s sake and to make it easier for viewers to digest your information, emphasize your display accuracy to make sure data visualization is efficient, thorough and precise.

6_ways_blog

What Employees Should Know about BI

While business intelligence and all of the critical information that it provides your organization is primarily best-served by your decision makers, its value should be felt company-wide. Some departments aren’ t even aware that big data is being collected on their efforts, and thus, when conversations regarding BI strategies are brought up, they fail to recognize its true impact.

Sure, your data analysts or independent BI team will be at the forefront of obtaining, displaying and breaking down what all those numbers mean, but the real question is — does your team even care?

They should. If implemented correctly, your BI tools should help make your company run smoother and more efficiently. Knowledge is power and arming your entire organization of its value will not only bring your team closer together, but may also bring about changes from new perspectives that were once previously left out.

In this post, we’ll detail some of the important aspects of business intelligence that every level of your organization should be aware of and why.

BI meeting with managersThe Strength of Big Data

Money makes the world go round, but what helps companies generate consistent business? Customer service, marketing and partnering with like-minded companies all serve this purpose. However, big data enables managers to precisely carve out an efficient budget that enables all of these factors to work collaboratively.

What some team members may overlook is the fact that it’s not just the access to data the matters. Too much data can sometimes be just as time-consuming and inefficient as not having enough information at your fingertips. The true value is the capability of analyzing the data that business intelligence tools provide. 

These tools provide the information that shapes several things including budgets, which projects to tackle, when to tackle them and even salaries. From the warehouse to the shipping department to the front office, BI works behind the scenes to put the entire organization in context and make it easier for team members on the front lines.

Doing Work On the Go

The future of business technology as a whole is leaning towards having the ubiquitous capability of conducting business while being mobile. As many decision makers are more often traveling outside the office, this capability suits them very well. And the same goes for some of the employees, too.

If your organization is on the rise and is expanding in size, the role of “decision maker” will likely also extend to more players. And that’s a good thing since BI tools are catering to this need. Being able to conduct the same amount of productivity while spending less time spent behind the desk and more time in the field is an extremely attractive feature that wouldn’t be possible without the innovations in BI and big data.

Business intelligence and teamworkReporting Made Easier with BI

Generating reports for higher-level executives can be a stressful task for employees as it likely entails crunching numbers, making sense of them and explaining their significance. BI tools allow these employees to simplify the process without having to request the assistance of an IT specialist — taking time away from both parties.

Depending on your current BI software, the convenient, user-friendly makeup of the BI interface should be formatted easy enough to provide the high-quality data that’s needed without it being too difficult to manage.

Building a Closer Organization

All in all, the progress in the business intelligence community is bridging the gap between entry-level employees, managers and executives.  The value of these connective tools offer a company openness that may have never been able to exist in past generations and its value cannot be underestimated.

The innovations aim to simplify the way work is done, offer more real-time information, grant employees more chances to work on-the-go and allow teamwork to be maximized.  While all employes may not use your BI tools, their knowledge of the technology can at least help them understand that the statistics that come to their desks are based in high-quality tools that have been in development for several years.

epm_blog

Why Are BI Editors Necessary?

When you were a kid preparing for important standardized writing tests or maybe your SATs in high school, teachers often tried to drill certain strategies in your head to help boost your performance: read over the question twice, check your work, show proof, etc.

While the platform for which these techniques are implemented has ultimately shifted as you’ve transitioned into an adult, the usefulness of these tools remain the same. You still check twice or maybe even three or four times before you press SEND on your emails, don’t you?

In the business of big data, the importance of editing cannot be underestimated. Giving your big data science team a helpful hand in making sense of all your complicated, quantitative data can be a huge benefit to your company’s leadership and throughout your entire organization.

In this post, we’ll highlight the perks of having a qualified BI editor on staff.

Chief directs to his employeesTake Responsibility Away from Higher-Ups

Managers aren’t glorified crossing guards who simply point and direct traffic within your department. A major part of their responsibilities include planning for the short- and long-term while trying to optimize your current processes. And in the planning stages, editing is crucial to devise a plan that is not only sound, but also digestible. The role of a BI editor is to allow the managers who oversee data collection to continue doing their job while simplifying the message for other data scientists and managers.

Furthermore, managers sometimes take on this role by themselves and turn out to not be that effective in clarifying messages. This creates more backup and traffic within your company that takes away from everyone’s job duties.

The subject of big data analysis can be a tricky as there are several complex components that make it up. It’s likely that managers aren’t fully-equipped to discuss the minute details as they are prepared to discuss the overall strategy and business intentions.

Simplify Your Most Complex Data

BI editorProfessional and effective business intelligence editors have honed their skills in breaking down unfamiliar ideas into simpler terms. And this is a quality that’s desired in an industry full of intricate nuts and bolts.

When plans or projections have to be discussed among different departments, it’s desirable when a common language can be determined. BI editors should be able to bridge the gap between the numbers-minded data scientists and the forward-thinking, revenue-minded project planners.

Often times, higher-ups have the tendency to throw out blanket ideas without a full grasp of how to turn it into a reality. Before tasking data scientists with translation duties, a business intelligence editor can save time by turning those ideas into tangible sketches.

Smooth Out Overall Communication

Your BI editor should also be flexible among the different departments in your company. Between proposals, papers and projections, some of the best editors are able to even simplify complicated code. Programmers who are in charge of the technical background of your business intelligence solution can write code that’s more complicated than need be.

Dubbed refactoring, this tactic simplifies difficult-to-read code into a more digestible, fluid language that makes it easier for anyone who access the programming code. The BI editor’s need to comprehend analysis isn’t necessarily needed, as long as they can decipher what the programmer’s intent was and how to make the code actionable.

As many long-term marriages credit communication as the reason for their longevity, it serves a similar purpose in your business. Having a business editor to smooth out the dialogue between different departments can serve as a huge advantage by streamlining processes and developing a more unified company.

epm_blog

How Important is Big Data Really?

Much is discussed in business intelligence circles about the importance of being able to collect and analyze big data. However, less is spoken of how important it truly is in maintaining a successful business. With thousands being invested in big data tools from businesses of all sizes, it’s pertinent to understand how effective that investment is and where it can be improved.

In this post, we’ll dig into the nuts and bolts of how and why big data investments fall flat for some companies, but help others excel.

Big dataKnow Your Data before You invest

What many business fail to remember is that simply purchasing a high-powered, multi-layered platform doesn’t necessarily mean that your work is now done. These tools are simply to enhance your current strategies and to maximize your data collection and analysis efforts. If you find that you’ve purchased a new data warehouse or software, but have yet to show progress since implementation, then it’s likely that you’ve wasted your hard earned dollars.

Before you bring on new technology into your company, you should be able to make use of the data you currently have. Without the knowledge of managing, analyzing and enhancing your data, the addition of a more complicated BI tool will only complicate things. And this is where many businesses fail. These tools are great additions if you already know what you’re doing, but it won’t do all the work for you.

In the same way children must learn how to divide regularly before they master long division, the same goes for your big data. In short, big data is truly helpful once you’re able to master how to manage all of your scattered information on a basic level first.

The Power of Evidence-Based Decision Making

Data analysisZooming into the concept of business intelligence, you’ll find that at the core of successful data management is the ability to identify the most important statistics and apply it to your company’s day-to-day decisions.

It’s these daily decisions that should be improved upon when you have a sound BI strategy. And evidence-based decision making isn’t a software you can buy that works on its own — it requires capturing the right data and knowing when and were to use it.

To help your company make the switch to this philosophy, this shift in mindset requires an overhaul in how your processes are defined, what data you’ll collect and a change to the way your business runs. Most importantly, those in your company who are the decision makers should have the critical performance data in their hands every day to allow them to maximize your business output.

Companies who exercise this method of utilizing their business intelligence typically employ these four strategies:

– Use one main source for performance information
– Allow decision makers to access real-time data
– Define & regularly optimize rules for data collection
– Tutor decision makers on how to use data tools

In summary, big data can be important if it’s used the right way. Don’t allow the chatter around the importance of big data influence your decision to invest in new tools if you’re not currently using healthy methods of data collection and analysis. Rather than trying to make use of big data right off the bat, start small. Make use out of the little data you have to help your key employees make healthier decisions on a daily basis.

Of course, enlisting the help of a data analyst may be a better first step before you make the choice of investing thousands in a technology that you may not know how to use to its full potential just yet.

6_ways_blog

Predictive Analytics: What It Is & How it Works

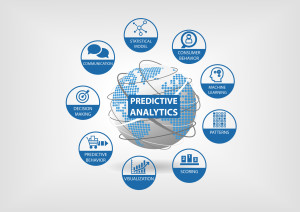
One of the main reasons why any organization invests in business intelligence solutions is so that they can make well-informed decisions backed by real-time data and accurate analytics. Your technology should take into account the past and present measurements that you’ve collected to give you a proper forecast for the future — and this practice is called predictive analytics.

For a more technical definition, Webopedia defines predictive analytics as “the practice of extracting information from existing data sets in order to determine patterns and predict future outcomes and trends.” In the same way a hypothesis is an educated guess, predictive analytics uses a variety of statistical techniques including data mining, modeling and machine learning to provide users with a reasonable expectation.

Predictive AnalyticsIts Role in Business Intelligence

There’s past, present and the future. With most business leaders having their eyes set on the future, predictive analytics serves as the perfect set of tools to plan accordingly. Key factors of a company’s infrastructure and outside factors have to be taken into account so they can make these decisions. Sales, trends, seasonal highs and lows, consumer buying behavior and more help analysts shape their projections.

It’s important to note that while this strategy can be a great aid for businesses and their choices, predictive analytics is based in possibilities, not facts. For data scientists or BI specialists, this means they can guide businesses in the right direction based on the odds of what the future may hold. The combination of a qualified and experienced BI expert with the big data collected from various sources allow companies to act with confidence in projecting the future of their performance.

Benefits of Predictive Analytics

A common example to explain the concept behind predictive analytics is homeowners and their mortgages. Mortgage lenders take into account factors like a resident’s recent payment history, credit, their buying or selling of other assets and more to plan for the next quarter of business.

These factors, likely given to decision-makers by BI analysts, allow them to devise a plan as to how they will use their capital. Perhaps more spending should be done on the promotional front, maybe the lender should disperse less money overall to prepare for foreclosures or loan defaults.

For organizations, this allows them to limit or contain the risk of the uncertainty that comes with running a business.

Software from organizations like SAP® “gives companies better insights in real time to increase understanding of customer behavior and improve response to customers and delivers tangible business value — ultimately driving profitability for organizations.”

Business AnalyticsReal Value

And that’s the major question most decision-makers will have: what’s the real value of this technology? Where’s the tangible effect that I can expect if I invest in this?

Remember, having data alone doesn’t mean anything. Many companies fail to realize that the true power in business intelligence goes beyond data collection. The power is in being able to successfully manage and store your data, being able to display it in a visually attractive manner, and more importantly, being able to use that data to make better decisions for the company’s future.

Predictive analytics is the portion of business intelligence that enables you to turn your data collection efforts into real results, if implemented correctly. For more information on how to select the right tools for your business intelligence or how to maximize the use of predictive analytics in your organization, contact one of our team members today to schedule an appointment!

epm_blog

3 Competitive Advantages of BI

Running a successful business entails more than maintaining sales, providing consistent service and staying the course. If your company’s leadership is determined to maximize progress, then your eyes are likely constantly set towards the future. And part of having an informed foresight has to do with understanding your past and current economics.

As many businesses were once doing this with spreadsheets or Excel documents, the times have changed to allow for an easier method of collecting data — using business intelligence (BI) solutions. These solutions transform the raw data that’s collected into useful information that is then used to make high-quality business decisions.

Monitor company-wide statisticsDepending on your market, the use of a BI solution can give you the slight advantage over your competitors that offer similar services or products. In this post, we’ll highlight the ways in which implementing a business intelligence system within your company’s infrastructure can revolutionize your standing in your industry and serve as a competitive advantage.

Company-wide Finances Made Simpler

According to projections from Gartner’s researchers, 3 out of 4 companies worldwide will place major responsibility on business intelligence by the year 2020. And as BI has grown into a $16 billion a year industry, its importance is showing no signs of stopping. If you’re considering making the jump from filling out spreadsheets manually or relying on the dated technology that is Microsoft Excel, investing in a long-term solution may be your best bet for your company’s evolution.

One of the main areas where BI can aid your organization is the ability to see your corporate finances. As your company grows in size, revenue and influence, so should your data collection efforts. Keeping track of physical paperwork or basic documents on your computer may do the trick, but for a better scope of your current finances and to be able to make effective projections, it’s highly recommended that you consider using a business intelligence solution instead.

Planning for the future is just good business — and business intelligence allows you to plan with more confidence and with a simpler display of complicated information. Condensing the intricacies of your data in a simplified, intuitive display also allows you to save much time that can be used in other areas of your company.

Cut Wasteful Spending

With a wider view of your company’s statistics, BI also gives you the opportunity to locate areas of waste. In the same way trainers aim to help their clients trim the fat, your BI tools should be able to help you identify areas of waste so you can save your dollars for a more important task.

Cut wasteful spendingA major part of maximizing your revenue potential involves eliminating your waste — and this goes for both financial numbers and the time spent in making choices, devising plans and analyzing the past and present. By trimming the fat of your organization, you’ll have the ability to strengthen your company’s core and run a more efficient team with faster, better decisions at the forefront.


Quicker & Smarter Decision Making

Moving towards the future requires a game plan. Whether it’s short-term goals that must be reached by the end of the quarter or if it’s long-term strategies that must be met at the end of the year, help from business intelligence can go a long way.

Being able to view your company’s data in a well-displayed, easily-readable format gives you the flexibility to make decisions with far more confidence than if you were simply looking at your old school spreadsheets.

Time is money. And you don’t want to waste either. With that said, implementing a business intelligence tool or software will lead the way to faster decisions and more informed choices that will allow your management team to maximize profits, while cutting costs and gaining a fuller understanding of the complex financial dynamics that make up your organization.

epm_blog