Author: Doug Hoogervorst

4 Ways BI Influences Profitability

Using big data via a business intelligence solution can influence your company's profitability.Just how important is having a strategy, solution or partner that focuses on business intelligence? Extremely important, if you ask us.

As a business owner, you should never underestimate the power of hardcore numbers. After all, businesses continue to run based on the positive, quantifiable nature of their sales and customers. Having the ability to measure your success or failures gives you the unbiased method to analyze exactly how well your company is doing. And for this reason, making use of your data is one of the most important ways to influence your team’s profits.

5 Things to Look for in Your BI Solution

Working people in the officeIn today’s age of business, there are several resources for the workplace that aim to help you run your business easier and more smoothly. And if you’re in the market for a business intelligence (BI) solution to capture and analyze your company statistics, there are some important factors you must consider before investing in a long-term addition to your business.

If you’re a new business, there will be several BI specialists who are anxious to persuade you to sign up for their services, partners and affiliates. However, if your goal is to find the perfect BI solution independent of any influences, let us give you an objective starting point. Here are five important characteristics to take into account during your search.

Unified Business Intelligence takes off at the Unified Wine & Grape Symposium

The breadth of stuff to see and experience at Unified can be intimidating. Hundreds of exhibitors from bottling to field sensors, engineers to reporters, corks to dorks. Having to have one message for such a varied audience was difficult as everyone comes to data from a different perspective.  We unified business intelligence for the attendees.

As I’ve reflected over the couple days since, my summary has been that delivering information – whether in dashboards, emails or however – is more interesting than ever. As a collective, we know we can get to so much more than ever and we are expecting it.

Our Unified Business Intelligence booth with TARGIT was incredibly well received. We live in an age now when we do expect to see sensor data trended over time and mixed with weather data plus market data. Lay over average price per bottle and average cost per bottle. AND give me a call to action from that information.

When we started reporting in the wine industry, we focused to start on 3-tier distribution and allocations. Today we have integrated DTC, customer lifetime value, inventory, AR, AP, financials, social media and have already started down vineyard data plus production. I was excited to expand our footprint – you, the attendees at Unified shared my excitement. I’m looking forward to more unified business intelligence in 2015.


SQL Pass Summit 2014 Great Success!

MDX, aggregations, scope assignments… SQL Pass Summit 2014 was data nerd heaven in terms of having access to uber experts who you can ask and learn from. Some learn from white papers only or maybe a book. Personally, I prefer face to face with real examples and it has been completely refreshing here at SQL Pass Summit 2014. Speakers this year have been completely focused on the tips and tricks.

I want to shout out to the following speakers:

Chris Webb, Peter Myers, Brian Larson, Kesper De Jong, Devin Knight, Miguel Llopis, Tessa Palmer, and David Peter Hansen. Really enjoyed your sessions. Hope you’ll be back!

 It will be interesting to see what happens next year. Not a lot of new work on SSAS multidimensional models (re: none) and some of the sheen is off the tabular model as its limitations are more and more known and not all that acceptable in some key places. Where is SQL Server 2016(?) going? There has been no word on it. Count on Microsoft to continue to empower the power user.

Here’s hoping:

  • that Power Query comes together to improve SSIS
  • that the difference between on-prem and cloud goes away
  • for data residence or delivery; there are too many “it works on prem but not in Power BI or you can use this in Power BI but not on prem”
  • that support for NON technical people continues. In talking to Power Query people, I kept hearing about M and connections with JSON. Those are not mainstream items when making a mainstream product.
  • MDX / DAX can become friends.


SQL Pass continues with more exciting Power BI

Day 2 at SQL Pass. Couple logistical things that have been a challenge. The sessions have staggered starts. Like some sessions at 10:30 and some starting at 10:45. It’s a pain for sure. Also it rains a lot in Seattle. Who knew?

After an evening of reflection, some summary thoughts on Day 1. The last year has been spent tying together a lot of the promise shown on Power BI and Power View and Power Query and delivering on these things. The sessions have been more focused on tips and tricks on what it can do and how to get there. Personally, I love it. I like living in the real world with real examples.

Previous years have been focused on what Power BI would do someday or the next things that Power View would do. While there are some new additions in terms of features, the speakers have been showing how to use Power Query, or Power View. And also exposing the limits with tips on working around.

Note, to real world, there are plenty of limits. It is not as simple as the demos. Incremental loads. Fiscal year to date without making this for every measure.

I imagine that when SQL 2016 or whatever it will be called is put on the timeline, Summit will revert to what is coming and not how to use it, but for now I’m excited for what comes today.

SQL Pass Demos Power BI and Power Query – looking good!

First day coming to an end here in Seattle at SQL Pass Summit. One more session today. Lots of demos of Power Query and Power BI, and these tools continue to mature. It is hard to tell what is “about to be released” and what is actually out, but the demos are fun to watch. Power Query has really come a long way. It now can connect to quite a few things – web pages, Salesforce.com, Business Objects, documents, Power Pivot models, databases – and you can do basic transformations like splitting columns. It looks cool for good Excel users who then want to make a Power View in Excel. Downside, well, it is in that one Excel sheet, not published yet.

Power BI has also come quite a ways. Released in February, it shows great with Power Maps but these are again simple demos, not necessarily useful demos. Overall the dashboards can be set up at a relatively lower cost for licensing. Entry level cost is $40/user/month if someone doesn’t have Office 365, plus the cost of consulting to set it up (or do it yourself). However, some big things are missing – like connecting to on-premise cubes, providing ad hoc access to people who don’t know how to set up dynamic time frames, and working with anyone who doesn’t have Office 365.

More reviews to come as we power through SQL Pass.


We are here – SQL Pass 2014!

Hello customers… one thing that defines us at Business Impact is our commitment to stay on top of what is happening in the world of business intelligence. We can do this dozens of ways, but our largest investment comes when we attend the SQL Pass 2014 Summit. Guess where Michele and I are today?

SQL updates and best practices are on display plus new technologies, sessions and more. It means we have to take a week out of our schedule to get here at SQL Pass 2014… but YOU get the benefit.

And while we’re here, please take advantage of us. If you have any questions on SQL Server, BI or products that have come up or that we haven’t been able to answer, please write me or Michele May.

Plus take a look at what sessions are offered while we are here!


Happy Anniversary Business Impact!

Okay, it feels like I’m a school kid, feeling a little giddy about our 9th birthday of Business Impact. To be honest, I started the company mainly to escape a setting where I felt the skills of business intelligence were vastly underappreciated. But today so many appreciate what we do – clients, co-workers, prospects, colleagues. It’s damn cool. So as I’m working late tonight, sipping on a very nice Rombauer Diamond Selection Cabernet (2005, no doubt), it’s good to feel grateful and to still truly enjoy what I do every day with the people I enjoy doing it with. Cheers!


Aptean BI – Business Intelligence Review

ApteanEdge2014-ExhibitAptean announced at its Edge conference a corporate BI platform in QlikView. One size will fit all. Pre-integrated dashboards ready to go; you could change them but then that is your responsibility. These were the messages regarding Aptean BI.

What does that mean for its customers, specifically in the Ross area where we have quite a bit of overlap here at Business Impact? Unfortunately we believe this means that Aptean has some learning to do regarding business intelligence.

In the session called Aptean Business Intelligence Strategy, the background was nicely set. Aptean has acquired a number of production software systems like Ross, all with different BI solutions.

Aptean’s due diligence was heavily weighted by Gartner, the software analyst firm. The final decision was QlikView over Microsoft BI, mainly because of version control. Microsoft’s BI required many layers of its technology and ensuring all customers were using the same versions of SQL Server, Sharepoint, Power BI, Office and whatever else is included in Power BI would be near impossible.The goal was a single BI platform that could cross system platforms – such as when a Ross customer also runs Pivotal CRM and Factory MES. Understandable, for sure. 

Meanwhile, QlikView is listed in the Leaders quadrant of Gartner, though my observational history with Gartner has been that the Leaders are the ones willing to pay the most for advisory services to Gartner. Another aspect listed was QlikView’s in-memory technology, which is definitely hot today.

Functionally, the biggest reasons given for QlikView were “data discovery” and “associative BI”. These were game changers, according to Aptean. Implied here is that the current BI tools were not providing these. This is ironic because the first BI tool Aptean is replacing is EPM powered by TARGIT. The irony comes from the fact that TARGIT is really very good at data discovery and associative BI when set up properly (the real downfall of most BI projects).

Pricing was not specified, but Aptean stated that this is not an upgrade and that customers will have to license Aptean Analytics. Starter packs would be sold where QlikView is embedded as part of the solution, and customers will receive pre-built dashboards and connectors plus some form of QlikView. One caveat, the customers must be on the current version of Ross/Pivotal/Factory. Separate Ross, Pivotal and Factory only solutions will be released as well soon. One question that came to our mind was: How many customers are current on all three software platforms at the same time now?

As for services, Aptean told customers they could be live on the application in less than an hour, depending on data load. Data loads and services were in general ignored, as was the roles of people utilizing them, project managing and other skills. In the end, this is the area where it seems like Aptean doesn’t understand the value or didn’t communicate that it did understand. And it’s the most important area (said from a BI consultancy, I know) because of all the permutations of implementations, multiple data sources, different types of corporate structures and more.

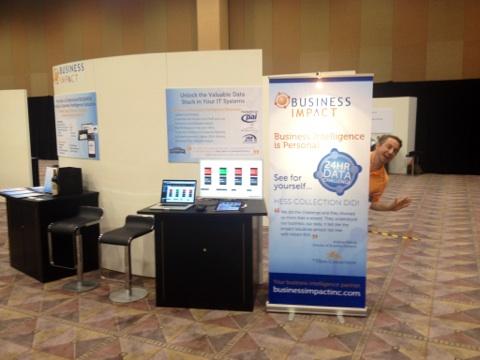
Back to the review for a moment, the visualizations from Aptean Analytics are nice though basic. QlikView does a strong job of Ad Hoc building and the web interface looked fast on the 23,000 records they were showing. The dashboards in general looked like a standard BI demo though with Ross demo data.

This leads us to the point of Analytics and Business Intelligence in general, and one that Aptean has missed with their release. Business Intelligence is personal. What data is needed… how a system is implemented… what role needs what dashboard… These vary site to site, role to role, and day to day.

At Business Impact, our stance has been and remains that a one-size fits all tool fits no one. And while QlikView / Aptean Analytics does offer the ability to make changes, so did EPM and so do most BI tools.

Business intelligence requires effort to make it fit: to architect in scalability, to allow for extension capability and to handle scope change. Who does that? That’s the $64,000 question, and one that is not answered by Aptean Analytics. Questions like how hard is it? Who does it? What is their skill set? Or more questions: has the business changed? When will it change again? How will we change our BI?

BI tools are incredible when in the hands of people who understand ALL of the following: business acumen, dimensional modeling, data integration, incremental loading, data visualization and the best practices of business intelligence. That’s a lot of roles.

The problem in Business Intelligence is that no one services person or developer can handle all these roles. If you have an uber-analyst, then they probably don’t know how to deal with enterprise scaling and security? If you have a DBA, they probably don’t know how to define inventory days on hand or why you would have different definitions based on the kind of business or seasonality of products.

One needs a skilled BUSINESS INTELLIGENCE team to support a business intelligence tool selection. One that understands that until you understand the business, you won’t ever get to business intelligence. It will just be reporting.

Just as one example, the sales dashboards shown at Edge were simple – sales by product and region and customer over time. None reached any depth such as demonstrating inventory levels at the same time as sales velocity and current open orders. And that is the kind of reporting and analysis that customers do.

So Aptean will offer turn-key BI with a new product. Like Ross’ previous BI attempt – EPM – it’s focus is on the turn key and it ignores the key lesson they should have learned from EPM for the last 10 years, that BI is personal.

Aptean Edge Review – From Behind the Sign

Roughly 1000 customers from a dozen computer systems have come to Aptean Edge at the MGM Grand hotel in Las Vegas, most happy to be out of the office and eager to hear the Aptean updates. Like most user conferences, Aptean Edge has sessions to lay out their road map, changes, updates and all the things that you do at a user show. In the keynote, it was the standard stuff on where they’re going, how much they value listening to the customers, the continued investment into each of their products, along with stuff on the cloud, mobility, changes in the world, etc. The facility is nice and food is reasonably good. The beers are expensive ($12 each) in the restaurants, but it is Vegas, so…Aptean Edge Booth

For us at Business Impact, we’re a first time exhibitor. We’ve gotten to see several of our customers in business intelligence, and that’s always nice. In addition it’s a back to my roots feel as I once worked for Ross Systems, which is one of the ERP systems under the Aptean umbrella. My old friends still working there have been very welcoming and cordial.

The big news from Aptean Edge has been the selection of a corporate wide BI tool – QlikView. The teams have pre-integrated six systems including Ross. There has been little word about the current BI like EPM at Ross and where that will lead other than to QlikView. There is a session on Analytics Strategy that we’ll attend and get more info out to Ross customers interested.

The show wraps up on Thursday afternoon. We are raffling off a fantastic bottle of Far Niente Cabernet Sauvignon 2009 at 5:30 pm on Wednesday evening – TONIGHT. Stop by and say hello “without a care” and enter to win a bottle of one of our client’s remarkable wines.