Author: Doug Hoogervorst

Convenience Stores Perform Market Basket Analysis To Increase Profitability

Market Basket

One of the most valuable pieces of information in the Convenience Store industry revolves around your customers’ buying habits, their market basket analysis.  Understanding your customers’ behaviors to develop effective merchandising strategies is key to protect and increase profits.  Market basket analysis allows management to quickly and easily look at the size, contents, and value of their customer’s market basket to understand the patterns in how products are purchased together, or basic product similarities. 

Business Impact’s business intelligence solution offers market basket analysis that can deliver near-instant results to encourage interactive analysis, enabling managers to drill down into customer buying patterns over time to precisely target and understand specific combinations of products, departments, brands, categories, sub-categories, and even time of day.

How Convenience Stores are leveraging Market Basket Analysis:

  • Develop more profitable advertising and promotions
  • Target offers more precisely
  • Attract more traffic into stores
  • Increase the size and value of the basket of purchases
  • Empower planners and merchants to make more informed decisions
  • Find the most valuable real estate space products sold together
  • Determine the “magic” price point for individual stores

And a ton more!!!

Business Impact has exceed their customers’ business intelligence reporting and analytics needs with offering additional key point indicators that could add additional value.  The beauty in this customized solution includes flexibility and ease of use that in turn offers capabilities to click and compare a variety of items or just one item to each store or one store, year to month to day, the data is all there, just select what you want and dynamically observe the store’s performance.

Watch this video for more information on market basket analysis for convenience stores.


Take Control of Your Convenience Store Purchasing Data

The glory days where distributors offered full guarantee on all spoilage seems to be gone and in general we see a trend of more and more activities being pushed downstream and your convenience store purchasing data is becoming more and more important to your profitability. We see store owners struggling to cope with:convenience store purchasing data

  • The need of speed and granularity with reporting
  • Coping with new areas of responsibility and how to analyze convenience store purchasing data
  • Becoming less reliant on distributors and their reporting
  • …and the C-store industry and competition is still growing!


Meanwhile, the environment is also changing and fuel efficient cars lower the frequency of opportunity, which only increases the opportunity cost caused by poor purchasing practices.

While analyzing the in-store data, what are your determining factors that identifies if a product should be rebought?  At what quantities? Or should a product be terminated from your price book?  How do you review your collected information with your distributors to negotiate better rebates or incentive programs? Is the speed of reporting appropriate or are your data reviews taking too long and causing stores to stock out on high margin products, ultimately costing you real dollars?

Here at Business Impact, we offer a solution that can take control of your convenience store purchasing data.  Business Intelligence is a growing need for all and we are focused on your industry to deliver reports and analytics like you’ve never seen before.  Our solutions offers flexibility and interactive interface that makes it simple to roll up daily data to week, month, quarter, then drill back down… or go from store totals, then drill down to category, sub-category, employee, etc…  It’s all up to the user and being able to easily and quickly display the data they are needing to discover the information they are looking for.

Here’s how we can help:

  • Reduce labor costs by automating processes and data
  • Cut out data traffic jams by enabling all users, not just IT
  • Making data actionable though indicators and alerts, and reducing clutter
  • Aligning business performance with objectives
  • Making better, faster decisions, making your C stores more profitable


Understanding the c-store environment, we have successfully deployed solutions as well as offered additional requirements that may have once been overlooked.  Don’t rely on your distributors’ data that may be inaccurate and possibly cost you missed rebates.  Automated pattern recognition and alerts will help increase your ability to predict high margin products stock levels, quickly allowing your team to discover which items may be a loss leader, or a hidden gems that deserve better placement.  Improve your ability to strike a healthy balance between profitability, inventory cost and sales flow by comparing across regions, districts and stores.  Analyze Inside Sales per square foot by department or category or whatever else you desire.  See average market basket of any transaction that has a Coke in it.  Or any Coke product.  Can you compare that with Pepsi?  We can!  You never have to go into a distributor meeting unarmed.  Have your convenience store purchasing and sales data at your fingertips.

Automating the collection and organization of your data for usage is a large part in any successful BI solution.  We pull the necessary data from the back office systems and other data sources.  Data can come from your accounting package, spreadsheets, a labor system, or somewhere else.  We focus on what adds most value, the ease of use, flexibility and performance is the design and management of this organization for delivery.

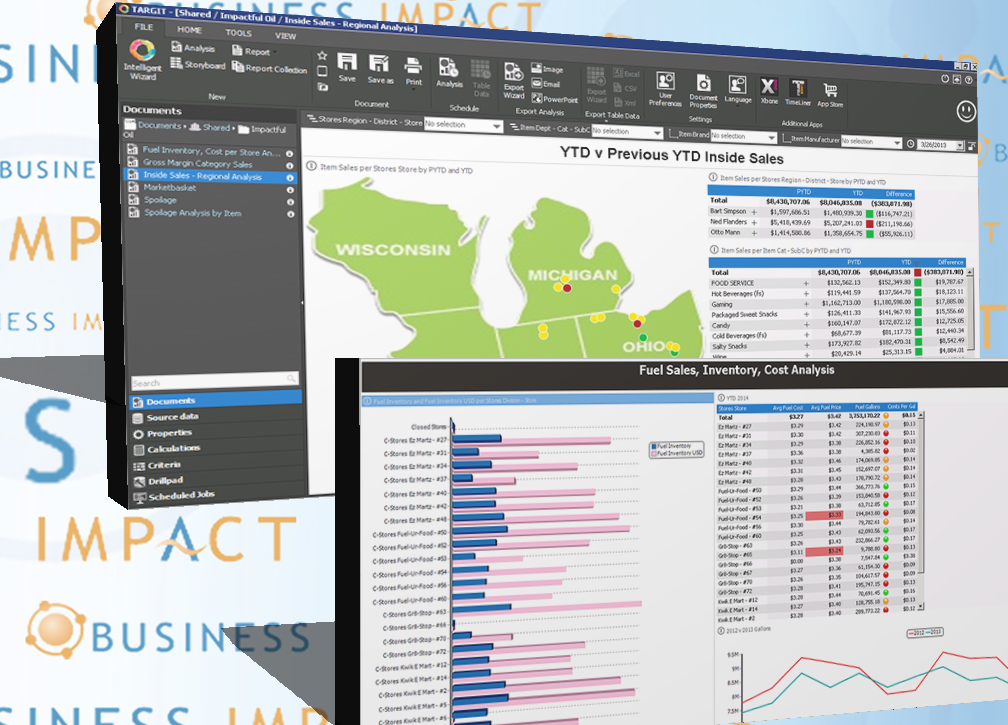
Check out our latest three minute video demonstrating convenience store’s Inside Sales Analysis.  Or contact us to learn more!


Wine Depletion Data and its Influence on the 3 P’s

How important to you is knowing your actual inventory level with your distributors.  Or knowing which product is being sold out of which retailer.  Some may say, not very, since your books already reflect a sale.  Others may reason that it’s hot on the priority list, so you can better manage your products, promotions and process

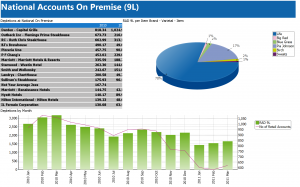
09) On Premise National Accts.1

Click to view larger image

The data provided to small and mid-size wineries often does not show product stock once it has been received by the distributor.  These wineries aren’t always aware of what retailer or restaurant is receiving their product.  If you were to say that you aren’t concerned because the initial sale already occurred and you collected your money for the distributor, than you are missing the big picture.

PRODUCTS:

What if your inventory was sitting in one distributor’s warehouse versus another’s who was completely out of stock?  Maybe certain products are received better in certain regions of the country, would that make you allocate your resources more effectively the following year?  Or perhaps one of your products never moves out of any of the distributors hands and just collects dust.  That’s probably going to affect two things, the relationship with your distributors since they were stuck holding onto your product, but also you may rethink production of the wine, or even review the marketing efforts as a whole.

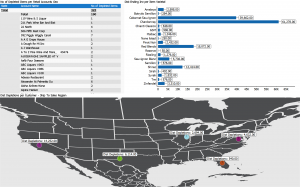
Understanding and knowing where your product ends up is a very important factor when it comes to making key business decisions.  The term used in the wine industry is known as wine depletion data to refer to sales from distributors to retail accounts.  The information below is the typical depletion results that are provided to wineries.
Wine Depletion

Click to view larger image

Typical Wine Depletion Data Results:

  • Shipment Data
  • Inventory Data
  • Retail Account Data


The typical wine depletion data provided is great to have and provides some insight into where your product ends up.  But the data can be analyzed so much further, giving your winery a leg up in promoting your product, or having your product become more profitable.

PROMOTIONS:

A winery that produces, let’s say 100,000 cases, only has a certain amount of resources to effectively promote and place to distributors.  Essentially once the last case is sold to the distributor, the winery’s job is done.  But is it?  Wouldn’t it be nice to know which product did the best and in which account or region?  That’s where wine depletion data combined with savvy business intelligence reporting helps answer those key elements.

Obtain the data on your product and analyze it against multiple amplitudes to diversify next year’s allocations and increase productivity.  Find out which product sold out the fastest to end customer to help manage production for upcoming years.  Evaluate the marketing efforts at a certain time period on a particular product to really understand how effective it was.

 Business Intelligence Wine Depletion Data Solution:

  • Monitor cases and bottles sold, annual revenue, yield, and profit margins associated with your sales force
  • Measure annual case production, vineyard acreage, grape harvest, quality of wine and service level
  • Track the sale of wine from distributor to consumers
  • Keep track of inventory including barrels, bottles and every component needed for packaging
  • Identify strengths and weaknesses in your distribution channels such as FOB, operating costs, on/off channels, number of accounts, lost accounts and new accounts


This list can go on and on and on, which is all helpful to increase success, but exactly how do we get there.

PROCESS:

Wouldn’t it be nice to be able to take it a step further and compare your wine depletion data to your internal sales data or allocation figures or shipment records?  Think about it, how much more could you possibly gain by being able to relate all your available data, internal & external, to uncover potential areas/departments that may need attention.  Some may argue that they sell out of their stock on a continual basis, but what if you were to implement a business intelligence solution that finds an opportunity to increase profitability among your allocations or reduce the cost of sales with shipments.  Businesses change often and quickly, so eventually there will be areas to improve or revamp.  None of the data collection sources alone will be able to deliver an enterprise business intelligence solution to ensure all of your departments are functioning at full capacity & efficiency.

The wine industry is different from any other product out there.  The reason being is the main ingredient, the grape!  Depending on the size of the vineyard, there are only so many grapes that can be plucked and squeezed to give us our always deserving juice!  So, limitations of the beginning product prohibit us from being able to call down to the production floor when inventory runs low and tell them to increase output.  Plus, after these grapes have been squeezed out of every last drop they don’t see the inside of a bottle, but a barrel, where they mature and ferment for periods of times, usually lasting longer than a couple years.  Again, there are limited resources in the wine industry and simply put, you can’t just increase production because you see an increase in demand.  It’s vital in the wine industry to get access and analyze your wine depletion data to have a strong understanding of who’s consuming your wine to stay competitive and knowledgeable in the industry.

Learn more about winery depletion data and analytics by viewing our Wine Webinar here!


Unified Wine & Grape Symposium Makes an Impression

Wow!! That’s some show. Having worked in the wine industry for more than eight years, I’ve seen the number of details that contribute to a beautiful glass of wine. Just not all in one GIANT room. Unified Wine & Grape Symposium sure makes an impression!  Sensors for vineyards. Software for production. Shears for pruning. Barrels. Glass for bottles and more.

What was interesting was the lack of companies that set the table on the information needed to run the company – from farming to production to inventory to sales in various channels.  There were a few companies there with accounting packages and point of sales but little that takes the entire company together.  I’m looking forward to an opportunity to demonstrate at a future Unified.

Interested in how business intelligence helps Executives at wineries make forward thinking business decisions?  Watch our wine webinar by clicking the button below.


Wine Business Intelligence guy visiting Unified in Sacramento

I’ve heard about Unified in the past, and for the first time I’ll attend Jan 28-30. I’m told the waiting list for vendors is more than a year long to have a booth. That sounds like a lot to me. And some have asked why I’m going to walk the floor if we aren’t selling. They are not sure what a business intelligence data guy like me will get out of it but meeting people, seeing the new stuff in the industry. I bet we get some new ideas.

We already go beyond your typical depletion and shipments reporting. Targit is a full self-service, ad hoc business intelligence tool and our expertise with more than 20 wineries is deep. We already built additional methods to manage territories and build budgets that go beyond our competitors.

We’ve grown into analyzing trade promotional dollars (whatever you call them: DAs, chargebacks, billbacks, postoffs, etc), inventory, AR, finances and purchases.

We’ve got a full Direct to Consumer solution that deals with analytics for tasting room, web sales and wine club. We’ve built an add on for inventory and costing analysis off Winemaker’s Database. And we’ve built an allocation engine down to the retail account level.

Our current project is a pricing engine that will integrate with automated DA (depletion allowances data). This will automate data flow, reduce data entry errors, and enforce accuracy of deals for both wholesalers and wineries.

All these new areas come from having a vision of what needs to be reported. What do we want to measure? How can we tell we’re doing a good/bad job? Asking and answering these questions. And because there will be new ideas and new methods and new technologies at Unified, well, I’m excited.

You can learn more about who we are and schedule a time to meet with me by clicking here

SQL PASS Summit Keynote

SQL PASS Summit Keynote

SQL PASS Summit Keynote

THANK GOD! I’m watching the keynote at SQL Pass and Microsoft SQL Server 2014 will allow us to ask for simple data we would never ask for and to graphically map it or chart it we would never want. No assistance on helping users join data from multiple systems where there is limited commonality. (Unless it is so clear the kids from the AT&T commercials could do it.) And now we can save the queries into a corporate library where all my fellow coworkers never know what my query is and be unsure that they are getting the right data so they have to build their own anyway. I am so tired of calling simple things powerful. Meanwhile, the memory performance stuff is cool and it seems like the concepts around hybrid databases between on and off premise are promising.

Business Impact will Exhibit at SQL Pass Summit 2013!

We’re excited to be hosting a booth at SQL Pass Summit 2013 in Charlotte, NC, from Oct 15-18. It’s our first time (we’ll always remember you Charlotte) and we’re excited because for the past eight years we’ve believed that you have to understand business to build business intelligence solutions. And now we’ll be able to talk with you and other conference attendees about our experiences at more than 70 customers. Experiences such as delivering product contribution and landed costs. About sales goals and budgets. Dashboards and delivery. Why come by? Well, we hope you will experience with us that business intelligence – while aided by SQL Server and technology – is based on understanding you, what you need, and how it can help your customer. We’re at booth 231 and hope you stop by.

Learn more about the event at SQL Pass website here!


SQL Pass

SQL PASS Exhibitor


Snapshot Tables Data Warehouse

Often our customers ask us to capture a specific point in time – say inventory or how much they are owed in Accounts Receivable – so that they can refer back to it later. Of course, this can be recreated by rolling back all the transactions but it is far easier to capture a snapshot of the data as of a point in time. This is stored then in data warehouse snapshot tables. Then you can trend back and compare today vs. last week or last month. This information is very basic in business intelligence because we want to compare today vs. something, whether it’s the past or a goal or what have you. [quote align=”right” color=”#999999″]…the most utility is trending for the last quarter and then keeping the snapshot as of the last day of a month…[/quote]

The drawback come in storing these points in time, these snapshots. Each snapshot is not altogether overwhelming in terms of storage, but keeping inventory by every product by every warehouse by every bin can be 10000+ records for a day and if you keep that each day for a year and then two years and so on… well, what is the utility of having your inventory position on Flag Day 2010? And it does add up in terms of space, especially when you add indexing.

We find that the most utility is trending for the last quarter and then keeping the snapshot as of the last day of a month or the week end (this depends on whether a business measures itself weekly or monthly). Thus, you keep every day for up to three or four months and then only keep the snapshot as of the period you measure. This balances storage v. utility.

Microsoft’s Master Data Management as a system?

Master Data Management (MDM) is important because dirty data means poor adoption, poor decisions and poor BI, but to think of it as a separate system is very difficult.[quote align=”right” color=”#999999″]Imagine SAP having to accept that the MDM team had chosen the global part code for a product will be X (as assigned by other systems) when it is Y in SAP. No way.[/quote] The lack of bi-directional data flows, the inability to have multiple layers of rules and workflows about data, and the fact that various source systems do not allow for MDM – all interfere with a practical use of MDM.  Microsoft’s MDM tool utilizes Excel to conform data. Imagine SAP allowing its product master to be conformed with other tangental ERPs in an enterprise to run MDM for products through Excel. While MDM in this case might help feed a DW, there is no way that SAP will allow MDM cleansed data back into SAP, especially having been managed in rules free Excel. And if SAP did allow for this, MDM rarely feeds back to the source systems. Imagine SAP having to accept that the MDM team had chosen the global part code for a product will be X (as assigned by other systems) when it is Y in SAP. No way. And no way for Oracle or JDE or Sage or Dynamics for that matter. To me, MDM is a data critical clean up  process that systems can help implement but there is no MDM software that will allow for automagical cleanup of data.

Stock out counts and other inventory balances

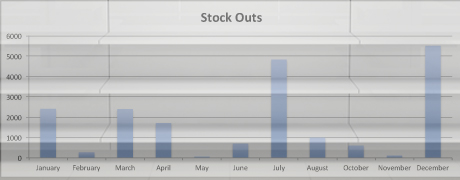
A client recently asked why their measure for Zero Inventory Counts (stock out counts) was running long, and you’d think getting a list of times you didn’t have inventory would be easy. Except, it depends on how you are figuring that out. For them it is very slow because they are not using a balances table.

Stock out Counts

The truest way to get an inventory balance is to add up all the transactions of a product for a location for a day (or month). And that is how they are doing this. A cube can be very fast at that. But if you want to count days where the balance added up to 0, well, now you are asking the cube to calculate a balance per product per location (warehouse) per day, assess whether it is 0 or not, and if 0, then add one. That’s pretty time consuming when you want a count by all products by all locations by all days (or at least a year). That’s thousands or millions of combinations much less aggregations.

A different way to do this is to create a balances table in the data warehouse. This table should hold the aggregated balance by product by location by day ahead of time. Will that be a lot of rows? Yes, and potentially you can narrow this down by doing it for a time frame, getting your counts and storing the counts (say at a week level). But now you will just be asking the cube to add up the 1s (or numerics) for each product / location / day. Much much faster.